Two different questions
- “Losing the next k spins in a row” = (loss probability)k. On a European wheel a red bet loses with probability 19/37, so seven straight losses is (19/37)7 ≈ 0.94%.
- “At least one run of k losses somewhere in n spins” is much larger, because every spin is a fresh chance for a streak to begin.
For a Martingale player the second number is the one that matters. The longer you play, the closer it gets to certainty.
Streak probability table (European wheel, always the same color)
| Streak | Starting right now | Within 50 spins | Within 100 | Within 300 | Within 1,000 |
|---|---|---|---|---|---|
| 5 losses | about 3.6% | about 60% | about 85% | over 99% | almost 100% |
| 7 losses | about 0.94% | about 19% | about 36% | about 75% | about 99% |
| 8 losses | about 0.48% | about 10% | about 20% | about 51% | about 91% |
| 10 losses | about 0.13% | about 2.6% | about 5.6% | about 17% | about 46% |
The “within n spins” columns are exact, computed by tracking the current streak length spin by spin (a Markov chain). On an American wheel (loss probability 20/38) each value is a bit higher; for example, seven straight losses within 300 spins is about 80%.
Getting a feel with coin flips
Even a perfectly fair coin produces streaks more often than people expect.
| Flips | At least 5 tails in a row | At least 7 tails in a row | At least 6 of the same side in a row |
|---|---|---|---|
| 20 | about 25% | about 6% | about 24% |
| 50 | about 55% | about 17% | about 54% |
| 100 | about 81% | about 32% | about 81% |
A classic classroom trick: half the students flip a coin 100 times, the other half invent 100 flips. The invented lists rarely contain long runs, because people imagine randomness as more even than it is. That intuition is the root of the gambler’s fallacy.
The longest-streak stat in the app
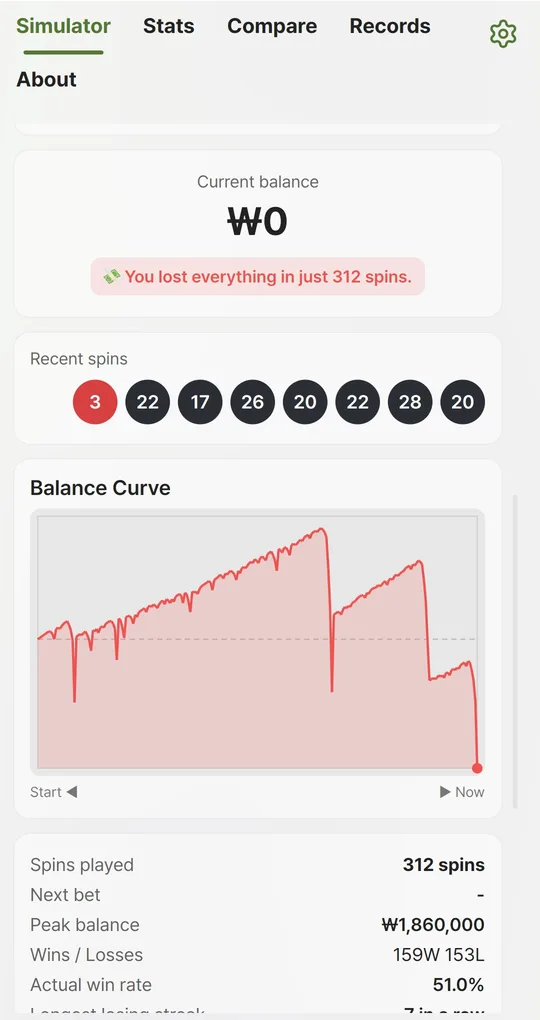
Spin slowly and count streaks
Set the speed to the slowest option or use the single Spin button. The recent-spins chips (red, black, green) and the longest losing streak update every spin. Note how many spins it takes before your first 5-loss and 7-loss runs.

Compare several saved runs
Saved results appear on the Records tab with spins played and the worst streak. Save several runs with the same setup and compare how many spins each took to go bust. The spread shows that nobody can predict when the streak will come.
FAQ
Can I compute this in a spreadsheet?
“Next k spins” is simply =(19/37)^k. “At least once in n spins” needs a table that moves the probability of each streak length forward one row per spin; simulating many runs and counting, as the app does, is easier.
Why is my longest streak different every run?
That is normal. Short records swing a lot even with fixed probabilities, and for a Martingale player that swing decides when the bust happens.
Martingale Bust - Roulette Sure-Win Simulator
Every amount is virtual. No sign-up, works offline. A free Android app for learning probability, in English and Korean.