Turn it into a z-score
Assuming a normal distribution, find how many standard deviations your score x sits from the mean (z), then look up the proportion in a standard normal table.
z = (your score − mean) ÷ standard deviation
For lower-is-better scores like reaction time, a more negative z is better. z = −1 means you’re faster than about 84%, i.e. top 16%. In Excel or Google Sheets, =NORM.S.DIST(z,TRUE) gives the share of people faster than you (for reaction time).
Top-% by milliseconds
Calculated with Reflex Lab’s Normal-difficulty Reaction Time baseline (mean 284 ms, SD 60 ms).
| Average reaction | z | Top | Rank |
|---|---|---|---|
| 185 ms | −1.65 | about 5% | S |
| 200 ms | −1.40 | about 8% | A |
| 220 ms | −1.07 | about 14% | A |
| 250 ms | −0.57 | about 29% | B |
| 284 ms | 0 | 50% | C |
| 320 ms | +0.60 | about 73% | D |
The same 220 ms gives a different top-% on Easy or Hard, because each difficulty has its own curve.
Rank thresholds
| Rank | Condition |
|---|---|
| S+ | Top 1% |
| S | Top 5% |
| A | Top 15% |
| B | Top 40% |
| C | Top 65% |
| D | Everything else |
Brain Score
Brain Score takes, for each test you’ve played, the share of people your best run beat, averages those, and maps the result to a 55–145 range. Dead average on every test gives 100. The range looks familiar, but it is not an IQ score and says nothing about intelligence. Only tests you’ve played count, so adding tests can push it up or down.
Age adjustment
Pick an age group in Settings and unlock Age-adjusted rank with one ad for 24 hours, and the app re-ranks you against your age group. For example, 60+ uses a speed baseline 30% slower than people in their 20s. That factor is the app’s approximation of broad trends in age and reaction-time research, not a precise norm.
In the app
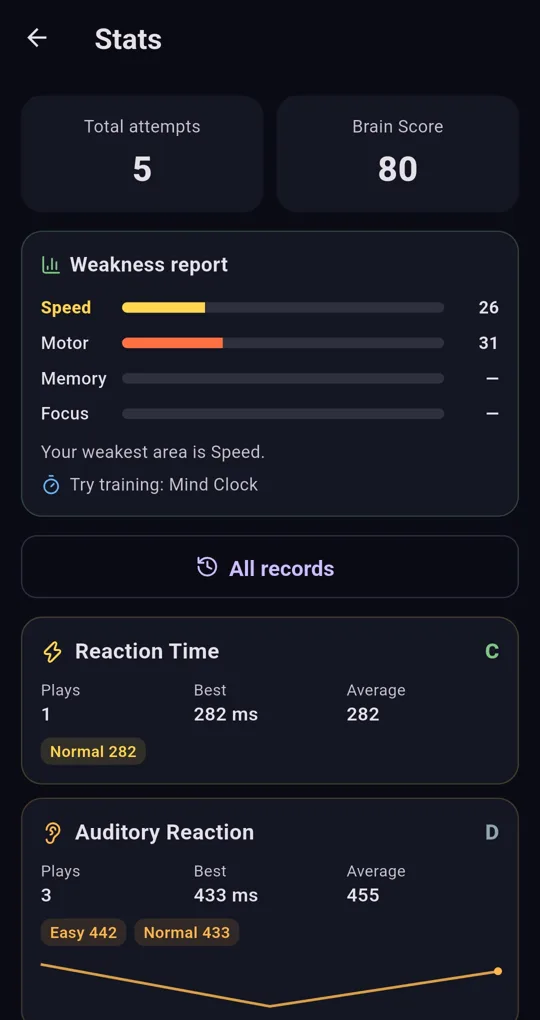
Per-test rank
In Reflex Lab’s Stats, the letter in the top-right of each test card (C, D…) is the rank of your best score. The result screen shows your spot on the curve and “Top X% of humans”.
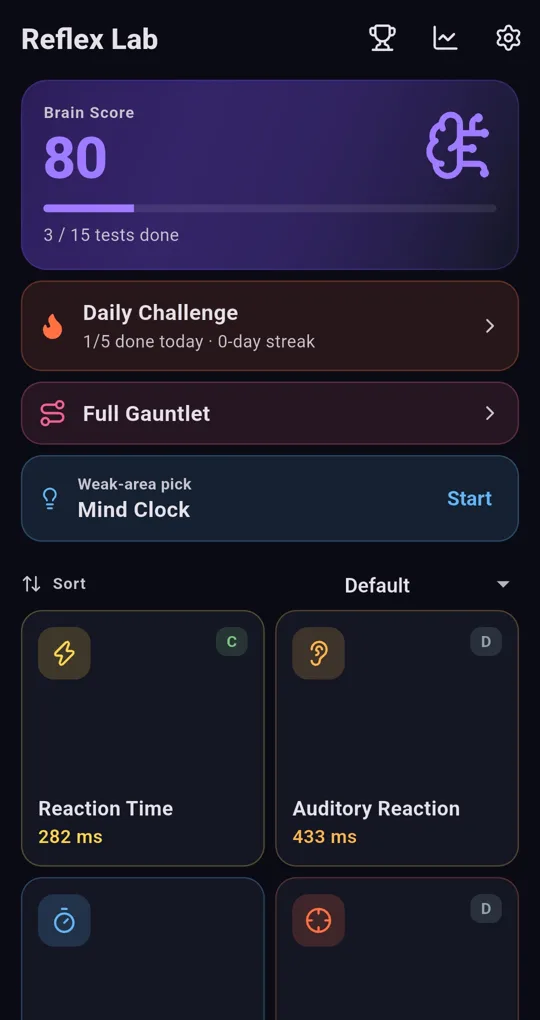
Brain Score on the home screen
The top card on the home screen shows your Brain Score and how many tests you’ve done (e.g. 3 / 15 tests done).
FAQ
Is “top % of humans” based on real worldwide data?
No. It’s an approximate curve whose mean and SD the app set from published statistics. Treat it as fun and motivation.
It won’t go past top 0.1%.
The display is capped between 0.1% and 99.9%. At that edge of the curve, finer distinctions don’t mean much.
Reflex Lab: Brain Speed Test
No sign-up, fully offline, records stay on your device. Free on Android.